Data
Chart Compass
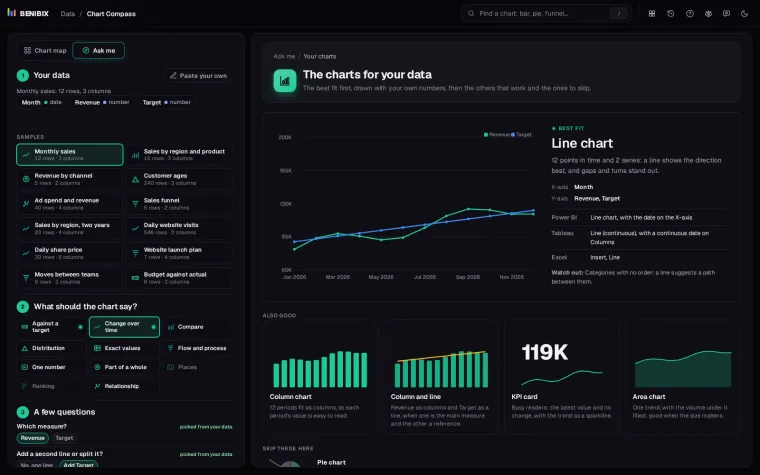
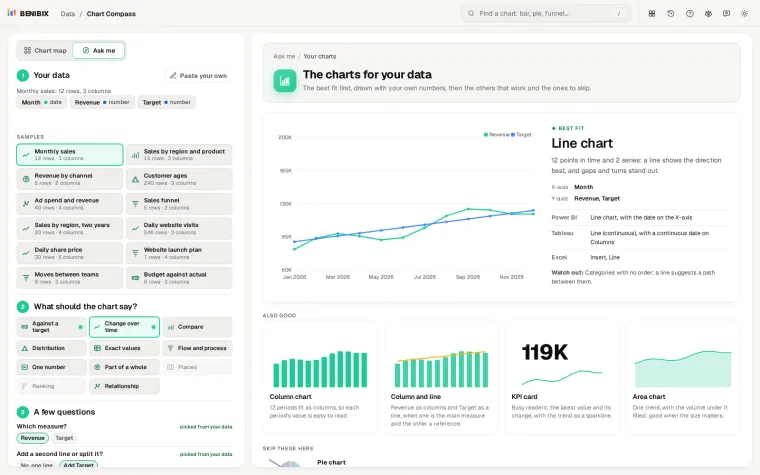
Paste your data, say what the chart should show, answer two or three questions, and see the charts that fit drawn with your own numbers, with their names in Power BI, Tableau and Excel.
Power BI, Tableau, Looker and the rest turn data into charts, and the charts are only as clear as their colours, fonts and layout. These tools design the look of a report, check it for contrast and colour blindness, and export files your BI tool imports. 3 are ready now.
Paste your data, say what the chart should show, answer two or three questions, and see the charts that fit drawn with your own numbers, with their names in Power BI, Tableau and Excel.
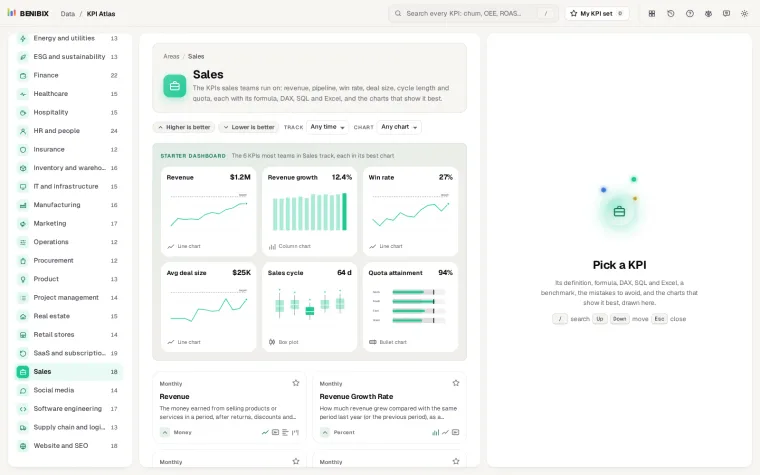
455 KPIs for 30 areas of a business, each with its definition, formula, DAX, SQL and Excel, a benchmark, the mistakes to avoid, and the charts that show it best, drawn.
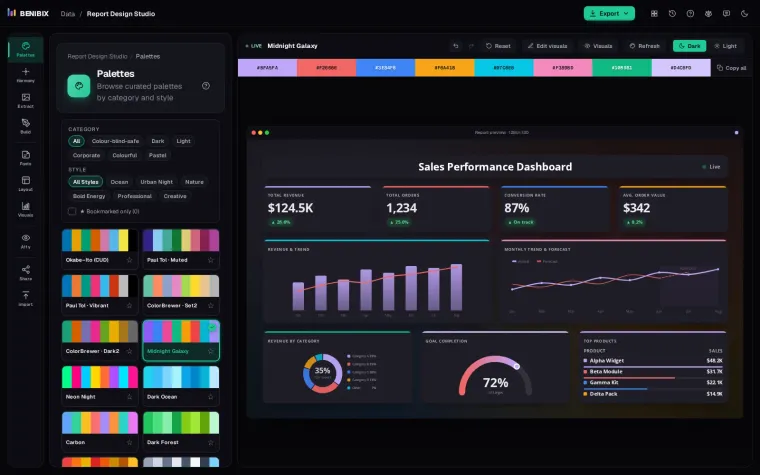
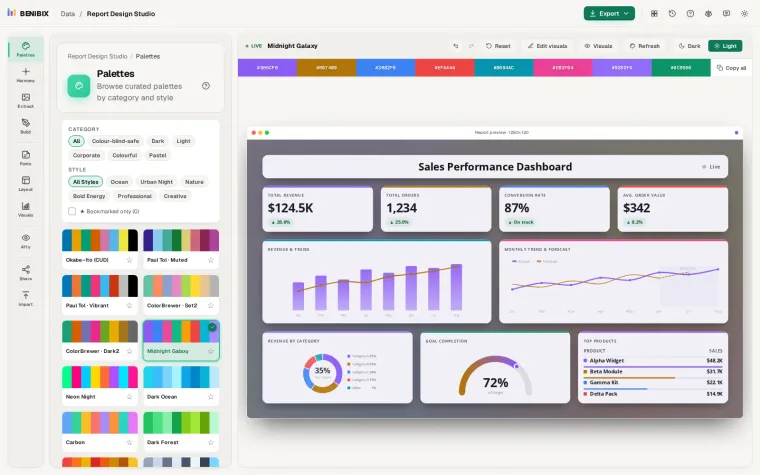
Design a report on a live preview: a Power BI theme (palette, fonts, every visual), a page layout with navigation, title bar and tiles, contrast and colour blindness checks, and exports for Power BI, Figma and PowerPoint.