Short answer: CSAT = answers rated 4 or 5 ÷ all answers × 100, on a 1 to 5 scale. If 367 of 412 customers rated their support 4 or 5, CSAT is 367 ÷ 412 = 89%. Show the number of answers next to it, because a score from 9 answers can swing 10 points on one bad day.
CSAT is the simplest customer survey there is: "How satisfied were you with ...?", one to five stars, right after a support chat, a delivery or a purchase. Its simplicity is also its trap: the same answers can give very different numbers depending on how you count them.
What is the CSAT formula?
CSAT = Answers rated 4 or 5 ÷ All answers × 100| Rating | Answers |
|---|---|
| 5, very satisfied | 251 |
| 4, satisfied | 116 |
| 3 | 23 |
| 2 | 12 |
| 1, very dissatisfied | 10 |
| All answers | 412 |
| CSAT | (251 + 116) ÷ 412 = 89% |
Customers who did not answer are not in the formula at all; more on that below.
Why count 4s and 5s instead of taking the average?
Because the average hides what you need to see. The same answers give an average rating of 4.42 out of 5, a number that sounds precise and says little: it cannot tell "everyone mildly happy" from "most delighted, a few furious". Counting the top two answers gives a share of satisfied customers, which is easy to read and easy to set a goal for.
Qualtrics puts it this way: "It has been shown that using the two highest values on feedback surveys is the most accurate predictor of customer retention."
If you do report an average, say so in the name ("average rating 4.42"), and never mix the two in one chart.
Why does CSAT per agent jump around?
Small samples. An agent with 8 answers, 7 of them good, has 87.5%; one more bad answer and it is 77.8%. Nothing about their work changed. Two habits help:
- Show the number of answers next to every score, and grey out scores from fewer than, say, 30 answers.
- Compare agents over a month or a quarter, not a week.
Who answers CSAT surveys?
Not everyone, and not a random sample. KPI Atlas lists "only happy customers answering" among CSAT's mistakes: the people who take the time to answer are not the same as the ones who do not. Track the response rate next to CSAT. If CSAT rises while the response rate falls, fewer unhappy people may simply be answering.
How is CSAT different from NPS and customer effort score?
| Score | Question | Scale | Counts |
|---|---|---|---|
| CSAT | How satisfied were you with ...? | 1 to 5 | Share of 4s and 5s |
| NPS | How likely are you to recommend us? | 0 to 10 | % of 9s and 10s minus % of 0s to 6s |
| Customer effort score | It was easy to get what I needed. | 1 to 7, agree | Share of 5s to 7s |
CSAT is about one moment, NPS about the whole relationship, and effort about how hard you made it. KPI Atlas notes that effort predicts disloyalty better than delight predicts loyalty, and warns against mixing a 1 to 5 scale with a 1 to 7 one. How to calculate NPS covers the second row.
What is a good CSAT score?
KPI Atlas gives 75 to 90% as common for support teams. Your own trend and the gap between teams or channels tell you more than any outside number: chat at 92% and email at 74% is a finding; 85% on its own is not.
How do you calculate CSAT in Power BI with DAX?
As KPI Atlas gives it, from a table with one row per answer:
CSAT % = DIVIDE ( CALCULATE ( COUNTROWS ( CSAT ), CSAT[Rating] >= 4 ), COUNTROWS ( CSAT ) )Put COUNTROWS ( CSAT ) in a second measure to show the number of answers next to it.
How do you calculate CSAT in SQL and Excel?
SQL, by week:
SELECT DATE_TRUNC('week', answered_at) AS week, COUNT(*) FILTER (WHERE rating >= 4) * 100.0 / COUNT(*) AS csat FROM csat_responses GROUP BY 1;Excel, with a table of answers:
=COUNTIFS(CSAT[Rating], ">=4") / ROWS(CSAT[Rating])How should you show CSAT?
A line chart of weekly CSAT with the target as a line. A bar chart by agent or team, with the number of answers on each bar. A 100% stacked bar of ratings 1 to 5 by week, which shows whether the 1s are growing even when the score holds.
Where can you check this?
Where do you find CSAT and the customer KPIs around it?
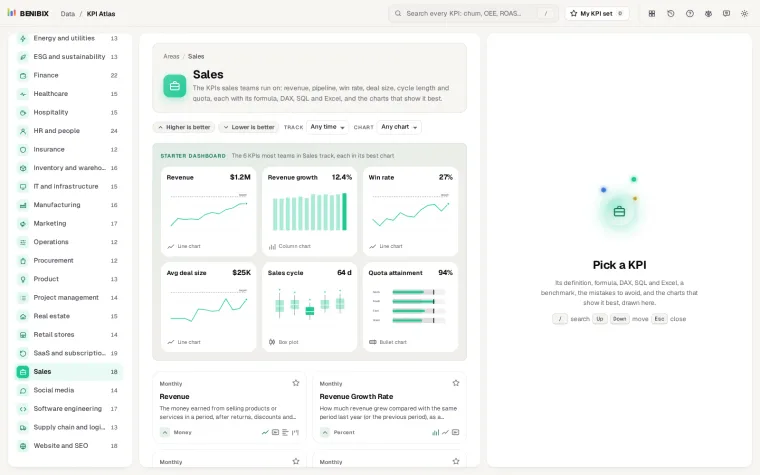
KPI Atlas has CSAT, customer effort score and Net Promoter Score with their formulas, the DAX, SQL and Excel above, the mistakes to avoid and their best charts drawn, next to first contact resolution and the other support KPIs. It holds 455 KPIs for 30 areas of a business.