Short answer: Ask "How likely are you to recommend us to a friend or colleague?" on a scale from 0 to 10. NPS = % of answers 9 or 10 (promoters) − % of answers 0 to 6 (detractors). With 200 answers, 112 promoters (56%) and 30 detractors (15%), NPS = 56 − 15 = 41. It runs from −100 to +100 and is written as a plain number, not a percentage.
NPS is the loyalty number boards ask for because it is one question and one number. It is also easy to get subtly wrong: leave the passives out of the total, report 41% instead of 41, or celebrate a three-point rise that is only noise.
How do you calculate NPS?
Sort every answer into one of three groups:
| Score | Group |
|---|---|
| 9 or 10 | Promoters |
| 7 or 8 | Passives |
| 0 to 6 | Detractors |
Then subtract the share of detractors from the share of promoters:
NPS = (Promoters ÷ All answers × 100) − (Detractors ÷ All answers × 100)| Input | Value |
|---|---|
| All answers | 200 |
| Promoters (9 or 10) | 112, so 56% |
| Passives (7 or 8) | 58, so 29% |
| Detractors (0 to 6) | 30, so 15% |
| NPS | 56 − 15 = 41 |
If every answer were a 10, NPS would be +100; if every answer were 6 or lower, −100.
Why do passives count if they are not in the formula?
Because they are in the total. Passives do not add or subtract, but they are part of "all answers". Leave them out and the same survey gives 112 ÷ 142 − 30 ÷ 142 = 79 − 21 = 58 instead of 41: a much better score that nobody measured.
Why is NPS not a percentage?
It is the difference between two percentages, so its unit is points. "NPS of 41" or "+41" is right; "41%" suggests 41% of customers are something, which no group is. A change from 41 to 44 is "up 3 points".
How many answers do you need?
More than most teams collect before they compare quarters. NPS mixes two shares, so its margin of error is wider than a single percentage's. Worked out with the usual 95% formula, for the example's mix of 56% promoters and 15% detractors:
| Answers | NPS is accurate to about |
|---|---|
| 50 | ± 20 points |
| 100 | ± 14 points |
| 200 | ± 10 points |
| 400 | ± 7 points |
| 1,000 | ± 5 points |
The formula, if you want it for your own numbers: margin ≈ 1.96 × √((p + d − (p − d)²) ÷ n) × 100, with p and d the promoter and detractor shares as decimals and n the number of answers. With 200 answers, a move from 41 to 45 is within the noise. Read the comments instead; that is where the reasons are.
What is a good NPS?
Anything above 0 means more promoters than detractors. KPI Atlas gives above 50 as excellent and 30 to 45 as common for B2B software. Compare with your own past quarters before you compare with anyone else, because the industry, the moment you ask (just after a purchase or after a support ticket) and who you ask all move the number.
The most common way to inflate it is to ask only happy accounts. Survey a random sample, or everyone, on a fixed schedule.
How does NPS compare with CSAT and CES?
| Metric | Question | Measures |
|---|---|---|
| NPS | How likely are you to recommend us? (0 to 10) | Loyalty to the company |
| CSAT | How satisfied were you with ...? (often 1 to 5) | One interaction or purchase |
| CES | How easy was it to ...? | Effort in one task, such as support |
Employee NPS (eNPS) uses the same formula with "How likely are you to recommend us as a place to work?"
How do you calculate NPS in Power BI with DAX?
As KPI Atlas gives it, from a table NPS with one row per answer:
NPS =
100 * DIVIDE (
    CALCULATE ( COUNTROWS ( NPS ), NPS[Score] >= 9 ) - CALCULATE ( COUNTROWS ( NPS ), NPS[Score] <= 6 ),
    COUNTROWS ( NPS )
)How do you calculate NPS in SQL and Excel?
SQL, by quarter:
SELECT DATE_TRUNC('quarter', answered_at) AS quarter,
       (COUNT(*) FILTER (WHERE score >= 9) - COUNT(*) FILTER (WHERE score <= 6)) * 100.0 / COUNT(*) AS nps
FROM nps_responses GROUP BY 1 ORDER BY 1;Excel, with the answers in a table named NPS:
=(COUNTIFS(NPS[Score], ">=9") - COUNTIFS(NPS[Score], "<=6")) / ROWS(NPS[Score]) * 100How should you show NPS?
A 100% stacked bar of promoters, passives and detractors by quarter shows what moved, which one number cannot. A line chart of NPS by quarter with a target shows the trend, and a bar chart by segment, product or region shows where it differs.
Read it with CSAT, customer effort score, customer health score and sentiment score.
Where can you check this?
Net Promoter®, NPS® and Net Promoter System® are registered trademarks, and Net Promoter Score℠ a service mark, of Bain & Company, Inc., NICE Systems, Inc., and Fred Reichheld.
Where do you find NPS and the customer KPIs around it?
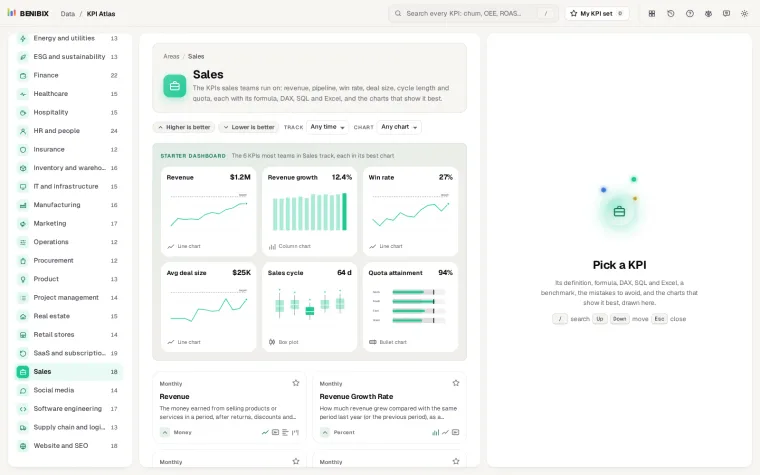
KPI Atlas has Net Promoter Score with its formula, the DAX, SQL and Excel above, the mistakes to avoid and its best charts drawn, next to CSAT, customer effort score, product NPS and employee NPS. It holds 455 KPIs for 30 areas of a business.