Short answer: For a subscription: LTV = monthly revenue per customer × gross margin ÷ monthly churn rate. A customer paying €50 a month at an 80% margin, with 2.5% of customers cancelling each month, is worth 50 × 0.8 ÷ 0.025 = €1,600 in gross profit. For a shop: LTV = average order value × orders per year × gross margin × years a customer stays.
Lifetime value is the number that tells you how much you can spend to win a customer. Get it too high (revenue instead of profit, or a lifetime of twenty years) and every growth plan looks profitable on paper while the bank account says otherwise.
What is the LTV formula?
There are two, because subscriptions and shops lose customers differently.
Subscription business (customers pay every month until they cancel):
LTV = (ARPA × Gross margin) ÷ Monthly customer churn rateARPA is the average monthly revenue per paying account. Dividing by churn gives the expected lifetime: with 2.5% churn a month, a customer stays 1 ÷ 0.025 = 40 months on average.
Shop (customers come back now and then, and simply stop):
LTV = Average order value × Purchases per year × Gross margin × Years a customer staysHow do you calculate it, step by step?
A subscription:
| Input | Value |
|---|---|
| ARPA | €50 a month |
| Gross margin | 80% |
| Monthly churn | 2.5% |
| Gross profit per month | 50 × 0.8 = €40 |
| Expected lifetime | 1 ÷ 0.025 = 40 months |
| LTV | 40 × 40 = €1,600 |
A shop:
| Input | Value |
|---|---|
| Average order value | €60 |
| Purchases per year | 2.5 |
| Gross margin | 45% |
| Years a customer stays | 3 |
| LTV | 60 × 2.5 × 0.45 × 3 = €202.50 |
Why use gross margin and not revenue?
Because a customer's revenue is not yours to spend. If 55% of every €60 order goes to the goods, the shipping and the payment fee, only €27 of it can pay back what you spent to win the customer. A revenue-based LTV (€450 in the shop example) is more than twice the margin-based one, and comparing it with acquisition cost makes almost any channel look worth it.
Many guides show the revenue version first, so check which one a number is before you compare it with yours.
Why cap the lifetime?
Because the churn formula has no ceiling. At 0.5% monthly churn, 1 ÷ 0.005 says the average customer stays 200 months: almost 17 years, and an LTV to match. Nobody plans on that, and a product rarely lives that long unchanged.
Cap the lifetime at 3 to 5 years (36 to 60 months) for planning. With the cap, the subscription formula becomes monthly gross profit × MIN(1 ÷ churn, 60).
For a shop, the risk is the opposite: "years a customer stays" is a guess when the shop is young. Use the share of customers who are still buying after one and two years, from your own orders, and keep the number low until you have the history.
What is a good LTV?
Only relative to what a customer costs to win:
- LTV:CAC of 3:1 or better is the common target: each customer brings three times what they cost to acquire. 1:1 means you spend everything you earn from them on winning them. Above 5:1 can mean you are under-spending and could grow faster.
- Payback within 12 months is a common rule of thumb for subscriptions: the customer has paid back their acquisition cost in the first year.
With the €1,600 subscription LTV and a customer acquisition cost of €420, LTV:CAC is 3.8. How to calculate customer acquisition cost (CAC) works out that €420.
How do you calculate LTV in Power BI with DAX?
Subscription, as KPI Atlas gives it, from measures for ARPA, gross margin and monthly churn:
LTV = DIVIDE ( [ARPA] * [Gross Margin %], [Customer Churn %] )Shop:
CLV = [AOV] * [Purchase Frequency] * [Gross Margin %] * [Avg Customer Lifespan Years]DIVIDE returns blank instead of an error in a month with no churn; that is a month to cap, not an infinite LTV.
How do you calculate LTV in SQL and Excel?
SQL, subscription and shop:
SELECT arpa * gross_margin / NULLIF(monthly_churn, 0) AS ltv FROM saas_unit_economics;

SELECT AVG(order_value) * AVG(orders_per_year) * 0.45 * 3 AS clv  -- 0.45 margin, 3-year lifespan: use yours
FROM customer_stats;Excel, with named cells:
=(ARPA * GrossMargin) / MonthlyChurn
=AOV * Frequency * GrossMargin * LifespanYearsTo cap the subscription lifetime at 60 months in Excel: =ARPA * GrossMargin * MIN(1 / MonthlyChurn, 60).
How should you show LTV?
A bar chart of LTV by acquisition channel shows which channels bring valuable customers, not only many. A line chart of cumulative gross profit per customer by months since their first order, one line per signup cohort, shows whether newer customers are worth more or less than older ones. A card with LTV next to CAC answers the question most people ask first.
Read it with customer churn rate, ARPA or average order value, repeat purchase rate and LTV:CAC.
Where can you check this?
- Klipfolio: customer lifetime value (CLV) and how to measure it
- Shopify: customer lifetime value, how to calculate CLV
Where do you find LTV and the KPIs around it?
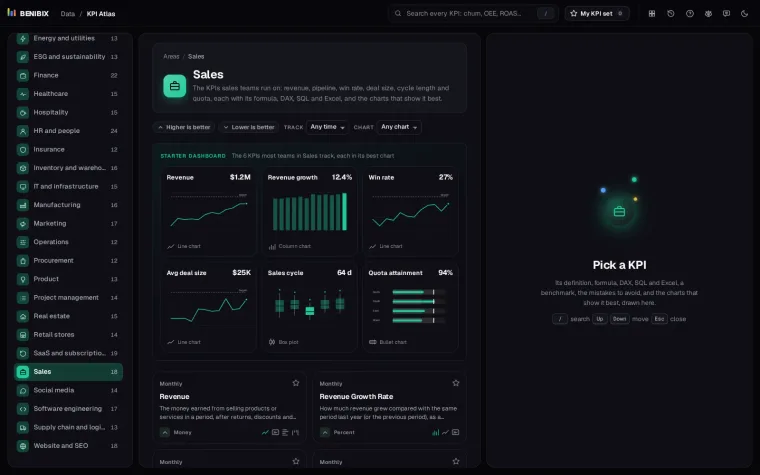
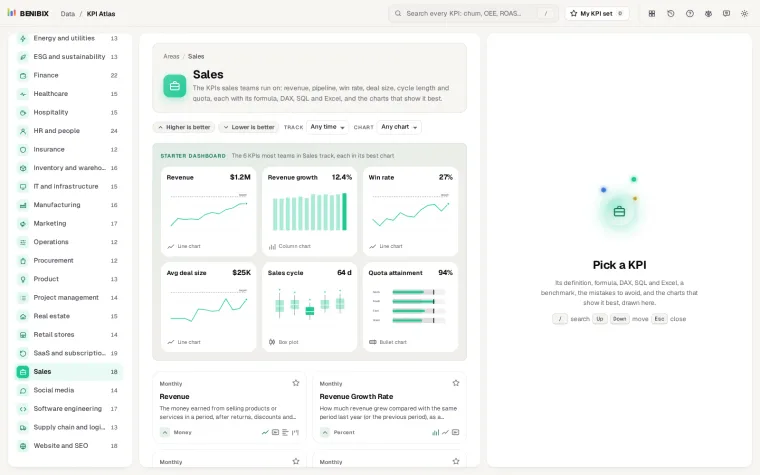
KPI Atlas has both versions, SaaS customer lifetime value and e-commerce customer lifetime value, each with its formula, the DAX, SQL and Excel above, the mistakes to avoid and its best charts drawn, linked to churn, ARPA, average order value and LTV:CAC. It holds 455 KPIs for 30 areas of a business.