Short answer: CAC = (marketing spend + sales spend) ÷ new customers won in the same period. With €24,000 of marketing and €18,000 of sales cost in a month that brought 100 new customers, CAC is 42,000 ÷ 100 = €420: each new customer cost €420 to win.
Ad platforms show a "cost per acquisition" that is often a fraction of that, because it counts only the ad spend and only the customers the ads claim. The real number has salaries, tools and agencies in it, and it decides whether growing faster makes money or burns it.
What is the CAC formula?
CAC = (Marketing spend + Sales spend) ÷ New customers acquired| Part | What goes in |
|---|---|
| Marketing spend | Ads, agency and freelancer fees, content and design, events, marketing tools, marketing salaries |
| Sales spend | Sales salaries and commissions, sales tools (CRM, calling, data), travel |
| New customers acquired | Customers who bought for the first time in the period, not repeat buyers |
Count everything you pay to win customers. Leaving salaries, tools and agency fees out is the most common way CAC ends up looking far cheaper than it is.
How do you calculate it, step by step?
One month, with the costs written out:
| Cost | Amount |
|---|---|
| Ad spend | €15,000 |
| Marketing tools, content and freelancers | €3,000 |
| Marketing salaries | €6,000 |
| Sales salaries and commissions | €16,000 |
| Sales tools | €2,000 |
| Total | €42,000 |
| New customers | 100 |
42,000 ÷ 100 = €420 per customer. The ad spend alone divided by the same 100 customers would say €150, which is why an ads-only figure must never be called CAC.
What is the difference between blended and paid CAC?
All three are in use, so say which one a number is:
| Version | Spend | Customers | In the example |
|---|---|---|---|
| Blended (the formula above) | All sales and marketing | All new customers | €42,000 ÷ 100 = €420 |
| Paid | Ad spend and paid-channel costs | Customers from paid channels only | €15,000 ÷ 40 = €375 |
| Per channel | That channel's spend | That channel's customers | e.g. search ads, events, partners |
Blended CAC answers "what does growth cost us?". Paid and per-channel CAC answer "where should the next euro go?". Never compare a paid CAC with a blended one, and never mix organic customers into a channel's CAC.
What if deals take months to close?
Then this month's spend wins next quarter's customers, and a month-by-month CAC jumps around: high in a month of heavy spend, low in the month the deals land. Two fixes:
- Rolling window. Divide three months of spend by three months of new customers. A 3-month rolling average is also the easiest line to read on a chart.
- Lagged spend. If a typical deal takes 60 days, divide the spend of two months ago by this month's new customers.
What is a good CAC?
There is no good CAC on its own: €420 is cheap for a customer worth €5,000 and ruinous for one worth €300. Judge it against what a customer brings:
- LTV:CAC. Customer lifetime value (gross profit before they leave) divided by CAC. 3:1 or better is the common target; above 5:1 can mean you could spend more and grow faster.
- CAC payback. CAC ÷ (monthly revenue per new customer × gross margin): how many months until the customer has paid back what they cost. A customer paying €50 a month at an 80% margin pays back a €420 CAC in 420 ÷ 40 = 10.5 months. Under 12 months is strong; 12 to 24 months is common in mid-market and enterprise software.
How do you calculate CAC in Power BI with DAX?
The measure, as KPI Atlas gives it, with a Spend table that has a column for marketing and one for sales:
CAC =
DIVIDE (
    SUM ( Spend[Marketing] ) + SUM ( Spend[Sales] ),
    [New Customers]
)[New Customers] has to count first purchases only. DIVIDE returns blank instead of an error in a month without new customers.
How do you calculate CAC in SQL and Excel?
SQL, from monthly spend and the first order of each customer:
SELECT s.month, (s.marketing + s.sales) / NULLIF(n.new_customers, 0) AS cac
FROM monthly_spend s
JOIN (SELECT DATE_TRUNC('month', first_order) AS month, COUNT(*) AS new_customers
      FROM (SELECT customer_id, MIN(order_date) AS first_order FROM sales GROUP BY 1) f
GROUP BY 1) n USING (month);The inner query finds each customer's first order, so repeat buyers are not counted as new. NULLIF avoids dividing by zero.
Excel, with a Spend table and the month's new customers in a cell named NewCustomers:
=(SUM(Spend[Marketing]) + SUM(Spend[Sales])) / NewCustomersHow should you show CAC?
A line chart of monthly CAC with a 3-month rolling average smooths out campaign spikes. A bar chart of CAC by channel shows where a new customer is cheapest. A combo chart with spend as columns and new customers as a line explains why CAC moved: more spend, or fewer customers.
Read it next to LTV:CAC, CAC payback, return on ad spend (revenue per euro of ads) and new customers acquired.
Where can you check this?
Where do you find CAC and the KPIs around it?
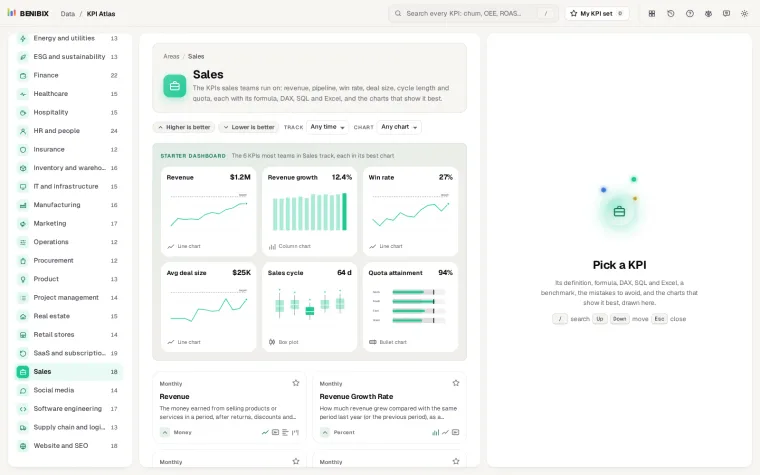
KPI Atlas has customer acquisition cost with its formula, the DAX, SQL and Excel above, a benchmark, the mistakes to avoid and its best charts drawn, linked to LTV:CAC, CAC payback and return on ad spend. It holds 455 KPIs for 30 areas of a business, so the rest of a growth dashboard is one search away.