Short answer: Gross margin = (revenue − cost of goods sold) ÷ revenue × 100. A business with €200,000 in sales and €108,000 in cost of goods sold has a gross profit of €92,000 and a gross margin of 92,000 ÷ 200,000 = 46%: of every euro it takes, 46 cents are left to pay for everything else.
Gross margin is the first number to look at when you ask whether a product can pay for itself. It is also the number most often calculated wrong, because margin and markup sound alike, and a price set with the wrong one leaves money on the table on every sale.
What is the gross margin formula?
Gross profit  = Revenue − Cost of goods sold
Gross margin = Gross profit ÷ Revenue × 100For a whole business:
| Input | Value |
|---|---|
| Revenue | €200,000 |
| Cost of goods sold | €108,000 |
| Gross profit | €92,000 |
| Gross margin | 92,000 ÷ 200,000 = 46% |
For one product: a mug that sells for €50 and costs €30 to make and ship in has a gross profit of €20 and a gross margin of 20 ÷ 50 = 40%.
What is the difference between margin and markup?
Both use the same profit, divided by a different number:
- Margin divides by the price: 20 ÷ 50 = 40%.
- Markup divides by the cost: 20 ÷ 30 = 66.7%.
| Markup on cost | Gross margin |
|---|---|
| 25% | 20% |
| 50% | 33.3% |
| 66.7% | 40% |
| 100% | 50% |
| 200% | 66.7% |
To convert: margin = markup ÷ (1 + markup), and markup = margin ÷ (1 − margin). A 100% markup, doubling the cost, is a 50% margin, never a 100% one: no price can leave you more than 100% of itself.
How do you price for a target margin?
Divide the cost by one minus the margin:
Price = Cost ÷ (1 − Target margin)For the €30 mug at a 40% target: 30 ÷ (1 − 0.40) = €50.
The common mistake is to add the margin to the cost: 30 × 1.40 = €42. That is a 40% markup, and at €42 the margin is only 12 ÷ 42 = 28.6%. On a thousand mugs, the wrong formula costs €8,000 of gross profit.
What goes into cost of goods sold?
Cost of goods sold (COGS) is what it costs to make or buy what you sold, and only that:
- In it: materials or the goods you bought to resell, the direct labour to make them, inbound freight, and the production costs tied to them.
- Not in it: marketing, sales salaries, office rent, admin and software for running the company. Those are operating expenses, and they come off later, on the way to operating and net margin.
What a company puts in COGS is partly its own choice, so two business units (or two companies) can report different margins for the same economics. When you compare, check that both count the same costs.
What is a good gross margin?
It depends on the industry far more than on the company. Average gross margins of US companies from Aswath Damodaran's dataset at NYU Stern, January 2026:
| Industry | Gross margin |
|---|---|
| Software (system and application) | 71.72% |
| Software (internet) | 62.58% |
| Apparel | 56.88% |
| Machinery | 37.47% |
| Retail (general) | 33.18% |
| Restaurants and dining | 32.24% |
| Retail (grocery and food) | 26.31% |
| Auto and truck | 10.41% |
| Whole market | 37.76% |
Compare yourself with your industry and with your own trend. A margin that falls month after month (rising costs, deeper discounts, a shift to cheaper products) is the earlier warning.
How do you calculate gross margin in Power BI with DAX?
As KPI Atlas gives it, from measures for revenue and cost of goods sold:
Gross Margin % = DIVIDE ( [Revenue] - [COGS], [Revenue] )Format the measure as a percentage. DIVIDE returns blank instead of an error for a month with no revenue.
How do you calculate gross margin in SQL and Excel?
SQL:
SELECT month, (revenue - cogs) * 100.0 / NULLIF(revenue, 0) AS gross_margin_pct
FROM monthly_pnl;Excel, with named cells (format as %):
=(Revenue - COGS) / RevenueAnd the target price: =Cost / (1 - TargetMargin).
How should you show gross margin?
A line chart of monthly gross margin with a target line shows the trend. A sorted bar chart of gross margin by product or customer group shows where the profit is made. A waterfall from revenue to gross profit (material, labour, freight, other costs) shows what eats it.
Read it with operating margin, net profit margin and average discount.
Where can you check this?
Where do you find gross margin and the margins after it?
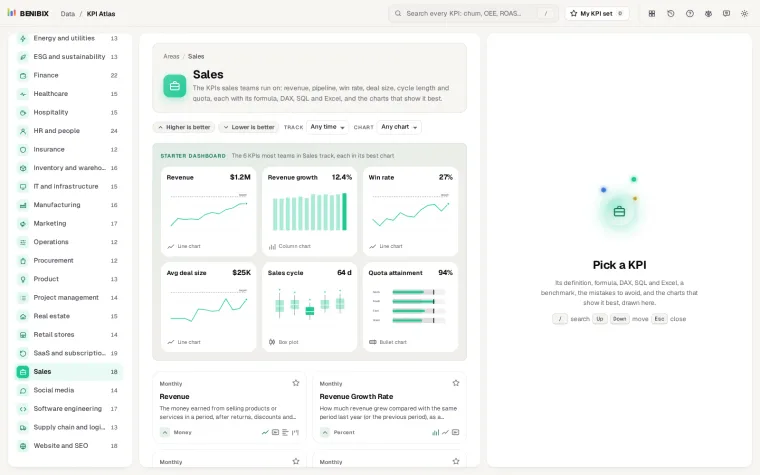
KPI Atlas has gross profit margin with its formula, the DAX, SQL and Excel above, the mistakes to avoid (markup called margin is the first) and its best charts drawn, next to operating, EBITDA and net profit margin. It holds 455 KPIs for 30 areas of a business.