Short answer: Net profit margin = net income ÷ revenue × 100. A company with €2,000,000 of revenue that keeps €180,000 after every cost, interest and tax has a net profit margin of 180,000 ÷ 2,000,000 = 9%: nine cents of every euro of sales is profit.
Net margin is the bottom line as a percentage: the final answer to "did we make money on what we sold?" Revenue can grow while the margin shrinks, and a small company with a 15% margin can earn more per sale than a big one with 3%.
What is the net profit margin formula?
Net profit margin = Net income ÷ Revenue × 100Net income is what is left after everything: the cost of what you sold, running costs, depreciation, interest and tax. It is the last line of the profit and loss statement.
How do gross, operating, EBITDA and net margin differ?
Each one takes off more costs. One profit and loss statement, step by step:
| Line | Amount | Margin |
|---|---|---|
| Revenue | €2,000,000 | |
| − Cost of goods sold | €1,200,000 | |
| Gross profit | €800,000 | Gross margin 40% |
| − Operating expenses (incl. €100,000 depreciation and amortisation) | €520,000 | |
| Operating profit (EBIT) | €280,000 | Operating margin 14% |
| EBITDA (EBIT + €100,000) | €380,000 | EBITDA margin 19% |
| − Interest | €40,000 | |
| − Tax | €60,000 | |
| Net income | €180,000 | Net margin 9% |
| Margin | Answers |
|---|---|
| Gross | Do we sell things for more than they cost us? |
| Operating | Does the business itself make money, before financing and tax? |
| EBITDA | The same, before depreciation; common for comparing companies with different equipment and debt |
| Net | Is there profit left for the owners at the end? |
How to calculate gross margin covers the first step, including margin versus markup.
What is a good net profit margin?
It depends on the industry far more than on the company. Average margins of US companies from Aswath Damodaran's dataset at NYU Stern, January 2026:
| Industry | Gross margin | Operating margin | Net margin |
|---|---|---|---|
| Software (system and application) | 71.72% | 32.98% | 25.49% |
| Machinery | 37.47% | 15.86% | 10.58% |
| Restaurants and dining | 32.24% | 15.79% | 9.37% |
| Retail (general) | 33.18% | 6.80% | 5.61% |
| Apparel | 56.88% | 9.11% | 3.85% |
| Retail (grocery and food) | 26.31% | 2.29% | 1.32% |
| Auto and truck | 10.41% | 2.32% | 1.29% |
| Software (internet) | 62.58% | 3.69% | −0.93% |
| Whole market | 37.76% | 12.82% | 9.74% |
(Operating margin here is the pre-tax, unadjusted one.) A grocery chain with a 2% net margin can be well run; a software company with 2% probably is not. And a high gross margin guarantees nothing: internet software keeps 62.58% after the cost of sales and ends below zero after everything else.
Why can net margin mislead?
Because it includes things that are not the business:
- One-off items. Selling a building, a write-off or a legal settlement can make one quarter look brilliant or terrible. Look at the trend over several quarters, and at operating margin next to it.
- Financing and tax. Two identical businesses, one with a large loan, have the same operating margin and different net margins. To compare how well businesses run, compare operating margin.
- Growth spending. A young company spending heavily on growth can show a negative net margin on purpose. Read it with burn rate and runway.
How do you calculate net profit margin in Power BI with DAX?
As KPI Atlas gives it, from two measures:
Net Margin % = DIVIDE ( [Net Income], [Revenue] )Format the measure as a percentage. DIVIDE returns blank instead of an error in a period with no revenue.
How do you calculate it in SQL and Excel?
SQL, from a quarterly profit and loss table:
SELECT quarter, net_income * 100.0 / NULLIF(revenue, 0) AS net_margin FROM quarterly_pnl;Excel, with named cells:
=NetIncome / RevenueHow should you show net profit margin?
A waterfall chart from revenue to net income shows where the money goes, step by step, the table above as a picture; How to make a waterfall chart shows how. A line chart of the quarterly margin shows the trend that one quarter hides.
Where can you check this?
Where do you find net margin and the margins before it?
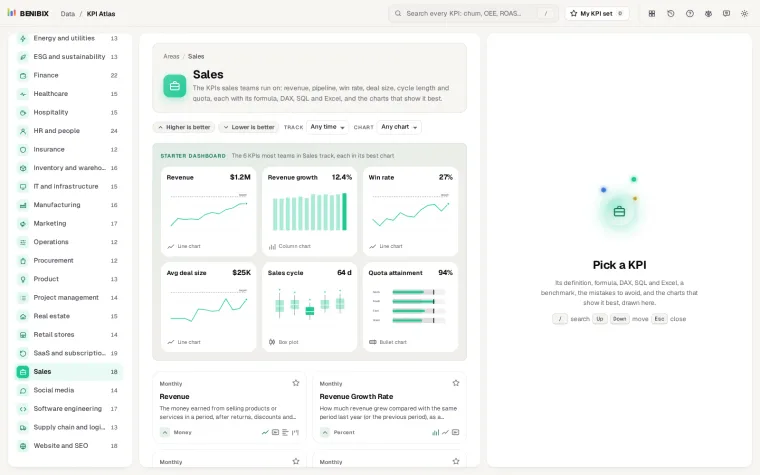
KPI Atlas has net profit margin, operating margin, EBITDA margin and gross margin with their formulas, the DAX, SQL and Excel above, the mistakes to avoid and their best charts drawn. It holds 455 KPIs for 30 areas of a business.