Short answer: Put the steps in order in two columns: the start value, each change (increases positive, decreases negative) and, in Excel, the end value. In Excel select them and choose Insert, Waterfall, then right-click the end bar and pick Set as Total. In Power BI choose Waterfall chart, put the steps in Category and the values in Y-axis.
A waterfall chart answers "how did we get from here to there?". Profit went from €120,000 to €130,000: was it price, volume, costs? A line or two bar charts show that it changed; a waterfall shows what changed it, one step at a time.
How do you lay out the data for a waterfall chart?
One row per step, in the order you want them read:
| Step | Value |
|---|---|
| Profit 2025 | 120,000 |
| Higher prices | 35,000 |
| More units sold | 22,000 |
| Higher costs | −41,000 |
| Exchange rate | −6,000 |
| Profit 2026 | 130,000 |
The changes have to add up: 120,000 + 35,000 + 22,000 − 41,000 − 6,000 = 130,000. If they do not, the chart still draws, but the last bar will not match your real end value, and someone will notice. Decreases are negative numbers, not positive numbers in a "decrease" column.
How do you make a waterfall chart in Excel?
Excel has had a built-in waterfall chart since Excel 2016:
- Select the table, both columns.
- Insert, then the waterfall button, then Waterfall.
- Right-click the Profit 2026 bar, then Set as Total. Without this, Excel treats it as one more increase and stacks 130,000 on top of the running total.
- Do the same for the first bar if you want it in the total colour too.
Set as total makes a bar start from zero instead of floating. It is also how you add subtotals in the middle, such as gross profit before overheads.
How do you make a waterfall chart in Power BI?
- Choose Waterfall chart in the Visualizations pane.
- Put the step column in Category and the value in Y-axis.
- Leave out the end value: Power BI adds the total bar at the end by itself. Keep the start value as the first step.
- Power BI shows the steps in ascending order of the category at first, so text steps come out A to Z. To keep your order, add a sort number column to the table and use Sort by column on the step column.
The Breakdown field does something different: it splits each step into its biggest contributors (by region, by product), and Maximum breakdowns in the format pane sets how many it shows before grouping the rest as "Other".
Can you make a waterfall chart in Google Sheets?
Yes, it is one of the chart types in the chart editor. Like Power BI, Google Sheets adds the total column at the end on its own, and has an option to treat the first value as a total, which draws your start value as a full bar from zero.
Why does my total bar float, or count twice?
The three tools treat the end value differently, and this is the mistake almost everyone makes once:
| Tool | Do you include the end value? | How the start and end become full bars |
|---|---|---|
| Excel | Yes, as the last row | Right-click, Set as Total |
| Power BI | No, it adds the total | Automatic for the end |
| Google Sheets | No, it adds the total | Automatic for the end; an option for the first value |
If the end bar is twice as high as it should be, you included the end value where the tool adds its own.
Which colours should a waterfall chart use?
Three: one for increases, one for decreases, one for totals. Use them the same way in every report, so readers learn them once. Green and red is the common pair, but about one man in twelve sees them as nearly the same colour, so make the difference also visible in lightness (a light green and a dark red), or use blue and orange. Label each bar with its change (+35k, −41k); the reader should not have to measure bars.
When is a waterfall chart the wrong choice?
- The parts do not add up to a total. A waterfall promises that they do.
- There are too many steps. Past eight or ten, group the small ones into "Other".
- You want to show stages that shrink, such as visitors, sign-ups, buyers. That is a funnel: each stage keeps part of the one before, nothing is added.
- You only want the trend. A line chart shows the trend better.
Where can you check this?
- Microsoft Support: create a waterfall chart in Excel
- Microsoft Learn: waterfall charts in Power BI
- Google Sheets API: waterfall chart options
Is a waterfall the right chart for your data?
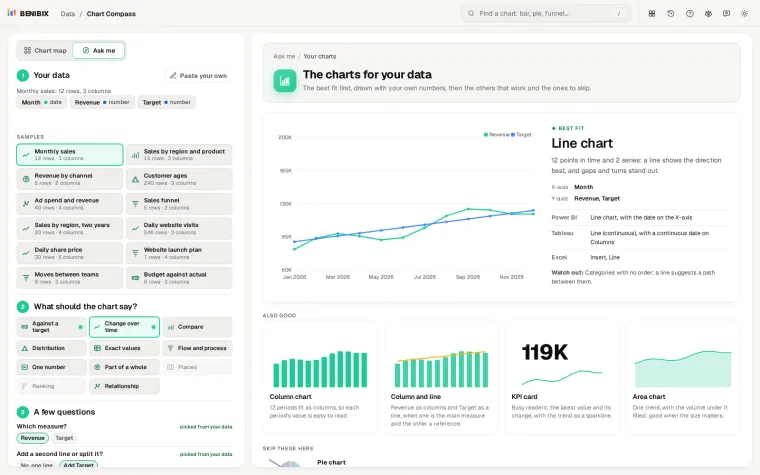
Chart Compass tells you. Paste your data, pick Flow and process, and it asks "Stages that shrink, or changes that add up?" (it already picks the bridge when your values go below zero). Then it draws the waterfall with your own numbers next to the funnel and a sorted bar chart, and says where each one is in Power BI, Tableau and Excel.