Short answer: Average order value (AOV) = revenue ÷ number of orders. €43,000 of sales from 500 orders is an AOV of €86. Decide once whether revenue includes shipping, tax and refunds, write it down, and use the same rule in every report.
AOV is one of the three numbers every shop's revenue is made of. You can win more visitors, convert more of them, or sell more to each one; AOV measures the third, and it is often the cheapest to move: a bundle, a free-shipping threshold or a well-placed add-on.
What is the average order value formula?
Average order value = Revenue ÷ Number of orders| Input | Value |
|---|---|
| Revenue in the month | €43,000 |
| Orders in the month | 500 |
| Average order value | 43,000 ÷ 500 = €86 |
Count orders, not customers or items: a customer who orders twice is two orders, and an order with three items is one.
How do AOV, traffic and conversion make up revenue?
Revenue = Sessions × Conversion rate × Average order value25,000 sessions × 2% conversion = 500 orders, × €86 = €43,000. Each lever moves revenue by the same percentage: 10% more traffic, 10% better conversion or 10% higher AOV all add €4,300 a month. How to calculate conversion rate covers the middle one.
What should revenue include?
There is no single right answer, but there must be one answer in your business:
| Item | Usually | Why |
|---|---|---|
| Discounts | Taken off | The customer never paid them |
| Shipping | Left out | It is not what people bought |
| Tax | Left out | It is not yours |
| Refunds | Depends | Taking them off is more honest, but changes last month's number later |
Shopify, for example, changed its AOV in January 2023 to "gross sales minus discounts", leaving out "any adjustments made to the order after it was created". The most common AOV mistake is not the choice itself but mixing two: shipping included in one report and not in another makes the same shop look like two.
Why look at the median order too?
Because a few big orders pull the average up. A shop with 495 orders around €80 and five wholesale orders of €700 has an AOV of €86 (43,100 ÷ 500), while the typical customer spends €80. The median (the middle order when you sort them) stays at €80. Show both, or leave bulk orders out of the AOV and report them on their own.
How do you use AOV to set a free-shipping threshold?
Look at the histogram of order values, not just the average. If most orders sit between €60 and €80, a free-shipping threshold just above that band gives many customers a reason to add one more item; a threshold far above it is ignored, and one below it gives shipping away for nothing. Then watch two things after the change: AOV, and the number of orders, which should not fall.
How do you calculate AOV in Power BI with DAX?
As KPI Atlas gives it, with net revenue and distinct orders:
AOV = DIVIDE ( SUM ( Orders[Net Revenue] ), DISTINCTCOUNT ( Orders[Order ID] ) )DISTINCTCOUNT matters when the table has one row per order line: counting rows would count items, not orders.
How do you calculate AOV in SQL and Excel?
SQL, by day:
SELECT DATE(order_date) AS day, SUM(net_revenue) / COUNT(DISTINCT order_id) AS aov FROM orders GROUP BY 1 ORDER BY 1;Excel, with a table of one row per order:
=SUM(Orders[Net Revenue]) / ROWS(Orders[Order ID])How should you show AOV?
A line chart of daily AOV with a 7-day average shows the trend without the weekday noise. A histogram of order values shows where a free-shipping threshold would bite. A bar chart of AOV by channel or customer type shows who buys more per order.
Read it with conversion rate, units per transaction and customer lifetime value.
Where can you check this?
Where do you find AOV and the shop KPIs around it?
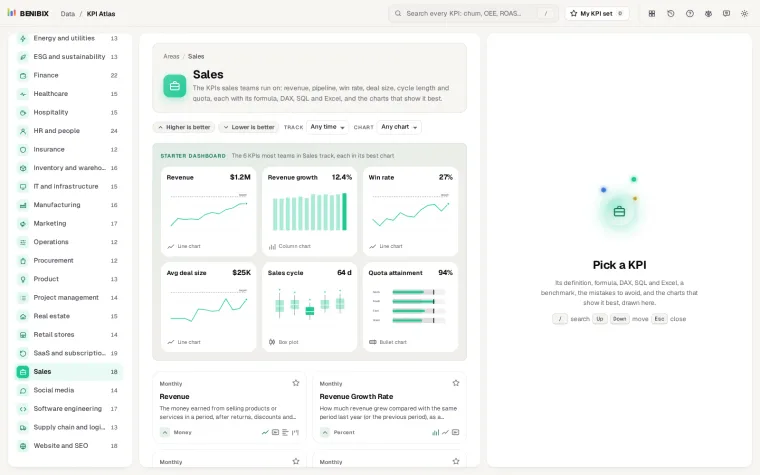
KPI Atlas has average order value with its formula, the DAX, SQL and Excel above, the mistakes to avoid and its best charts drawn, next to e-commerce conversion rate, units per transaction, repeat purchase rate and customer lifetime value. It holds 455 KPIs for 30 areas of a business.