Short answer: Inventory turnover = cost of goods sold ÷ average inventory at cost. A shop with €1,240,000 cost of goods sold in a year and stock worth €180,000 at the start and €220,000 at the end turns its inventory 1,240,000 ÷ 200,000 = 6.2 times a year. In days: 365 ÷ 6.2 = 59 days of stock.
Inventory turnover tells you how fast stock becomes sales. Every euro on a shelf is cash you cannot use for anything else, and stock that sits too long goes out of fashion, out of date or obsolete. Faster turns mean less of both, up to the point where shelves run empty.
What is the inventory turnover formula?
Average inventory    = (Inventory at the start + Inventory at the end) ÷ 2
Inventory turnover = Cost of goods sold ÷ Average inventory| Input | Value |
|---|---|
| Cost of goods sold, 12 months | €1,240,000 |
| Inventory at cost, start of year | €180,000 |
| Inventory at cost, end of year | €220,000 |
| Average inventory | €200,000 |
| Inventory turnover | 1,240,000 ÷ 200,000 = 6.2 |
How do you turn it into days?
Divide the days in the period by the turnover, or use the formula directly:
Days of inventory = Average inventory ÷ Cost of goods sold × 365200,000 ÷ 1,240,000 × 365 = 59 days: the stock on hand would last about two months at the current rate of sales. Days are easier to act on than turns ("we hold two months of stock" is a sentence a buyer understands), but too few days is not good either: it means stockouts.
Why use cost of goods sold and not sales?
Because inventory is valued at cost, and both sides have to be in the same money. Mix them and the number lies:
| Calculation | Result | What went wrong |
|---|---|---|
| Cost of goods sold ÷ inventory at cost | 6.2 | Nothing: cost against cost |
| Sales (€2,000,000) ÷ inventory at cost | 10.0 | The margin is counted as if it were stock sold: looks about 60% better |
| Cost of goods sold ÷ inventory at retail price (€360,000) | 3.4 | Stock is counted at its price: looks barely more than half as good |
Pick cost on both sides, write it next to the number, and compare only numbers made the same way.
What if your stock is seasonal?
Then the start and end of the year are a poor average. A shop that is nearly empty in January and full in November has a low start and a low end, so the "average" misses the peak and the turnover looks better than it is. Average the twelve month-end values instead, which is what the DAX below does.
What is a good inventory turnover?
It depends on what you sell. KPI Atlas gives these typical ranges:
| Industry | Turns a year | Days of stock, about |
|---|---|---|
| Grocery | 12 to 20 | 18 to 30 |
| General retail | 4 to 8 | 46 to 91 |
| Industrial goods | 3 to 6 | 61 to 122 |
Compare categories within your own business before anything else. A slow category with a thin margin is the problem corner; a slow category with a fat margin may be fine, which is what gross margin return on inventory (gross margin ÷ average inventory at cost) measures.
How do you calculate inventory turnover in Power BI with DAX?
As KPI Atlas gives it, with the last twelve months of cost of goods sold over the average of the month-end stock values:
Inventory Turnover = DIVIDE ( [COGS Last 12 Months], AVERAGEX ( VALUES ( 'Date'[Month] ), CALCULATE ( SUM ( Stock[Value At Cost] ), LASTDATE ( 'Date'[Date] ) ) ) )How do you calculate inventory turnover in SQL and Excel?
SQL, by category:
SELECT category, SUM(cogs_12m) / NULLIF(AVG(avg_stock_value), 0) AS turns FROM category_inventory GROUP BY category;Excel, with named cells:
=COGS / AVERAGE(StartInventory, EndInventory)How should you show inventory turnover?
A sorted bar chart of turns by category with the target line shows which categories are slow. A line chart of rolling twelve-month turns shows the trend without seasonal jumps. A scatter plot of turns against margin per category finds the slow, thin-margin corner.
Read it with days of inventory, gross margin return on inventory, stockout rate and obsolete inventory.
Where do you find inventory turnover and the stock KPIs around it?
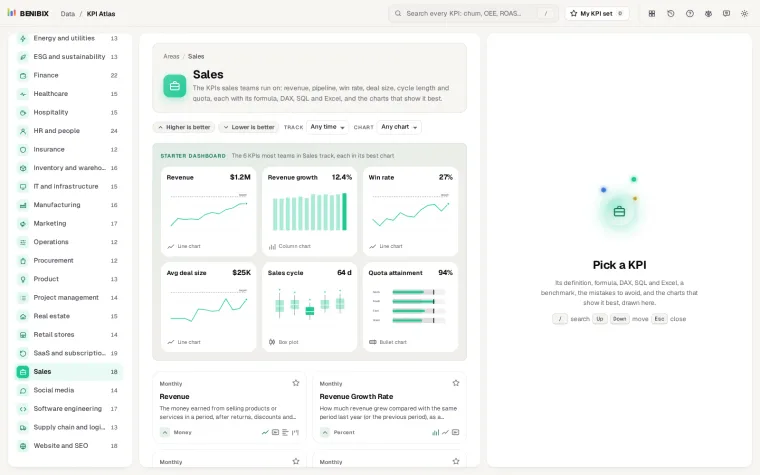
KPI Atlas has inventory turnover with its formula, the DAX, SQL and Excel above, the mistakes to avoid and its best charts drawn, next to days of inventory, stockout rate, inventory accuracy, obsolete inventory and safety stock coverage. It holds 455 KPIs for 30 areas of a business.