Short answer: Customer retention rate = (customers at the end − new customers in the period) ÷ customers at the start × 100. You start the quarter with 500 customers, win 50 new ones and end with 520: (520 − 50) ÷ 500 = 94% retained, so 6% churned.
Retention is churn seen from the bright side: how many of the customers you already had stayed. It is easier to set goals with ("keep 95%") and it is the base of customer lifetime value: the longer customers stay, the more each one is worth.
What is the customer retention rate formula?
Customer retention rate = (Customers at end − New customers) ÷ Customers at start × 100| Input | Value |
|---|---|
| Customers at the start of the quarter | 500 |
| New customers during the quarter | 50 |
| Customers at the end of the quarter | 520 |
| Still there from the start | 520 − 50 = 470 |
| Customer retention rate | 470 ÷ 500 = 94% |
Why do you take the new customers out?
Because they were not there to lose. The common mistake is end ÷ start: 520 ÷ 500 = 104%, a retention rate over 100% that says nothing about the 30 customers who left. Growth hides losses; taking the new customers out shows them.
How is retention related to churn?
For the same customers and period, they add up to 100%:
Churn rate = 100% − Customer retention rate94% retention is 6% churn: 30 of the 500 starting customers left. How to calculate churn rate covers churn, including revenue churn, which can tell a different story when big and small customers leave.
Why does retention matter so much?
Because keeping a customer usually costs much less than winning one. Harvard Business Review, citing Bain & Company's Frederick Reichheld: "increasing customer retention rates by 5% increases profits by 25% to 95%", and acquiring a new customer is "anywhere from five to 25 times more expensive than retaining an existing one". The exact numbers vary by study and industry, but the direction does not.
What about shops without subscriptions?
A shop has no "start" and "end" list of customers: people just stop ordering. Use the repeat purchase rate instead, the share of customers who ordered more than once:
Repeat purchase rate = Customers with 2 or more orders ÷ All customers × 100280 repeat buyers out of 1,000 customers is 28%. KPI Atlas gives 20 to 40% as common, depending on the category; things people use up (coffee, pet food, skincare) run higher. Two traps: guest checkouts can count the same person as a new customer every time, and a new shop always looks worse, because repeat buying needs time.
How do you see retention by cohort?
One number for all customers mixes the loyal old ones with the new ones who have had no chance to leave yet. A cohort chart groups customers by the month they joined and shows the share still active one, two, three months later. If the newer rows fall faster than the older ones did, something changed: the product, the price or the kind of customer your ads bring in.
How do you calculate customer retention rate in Power BI with DAX?
As KPI Atlas gives it, from three measures:
Customer Retention % = DIVIDE ( [Customers at End] - [New Customers], [Customers at Start] )And the repeat purchase rate, from an orders table:
Repeat Purchase % =
VAR Cust = ADDCOLUMNS ( VALUES ( Orders[Customer ID] ), "n", CALCULATE ( DISTINCTCOUNT ( Orders[Order ID] ) ) )
RETURN DIVIDE ( COUNTROWS ( FILTER ( Cust, [n] >= 2 ) ), COUNTROWS ( Cust ) )How do you calculate it in SQL and Excel?
SQL, from a table with one row per quarter:
SELECT (end_customers - new_customers) * 100.0 / NULLIF(start_customers, 0) AS retention_pct FROM quarter_customers;Repeat purchase rate from the orders:
SELECT COUNT(*) FILTER (WHERE n >= 2) * 100.0 / COUNT(*) AS repeat_pct
FROM (SELECT customer_id, COUNT(DISTINCT order_id) AS n FROM orders GROUP BY customer_id) c;Excel, with named cells:
=(EndCustomers - NewCustomers) / StartCustomersWhere can you check this?
Where do you find retention and the KPIs around it?
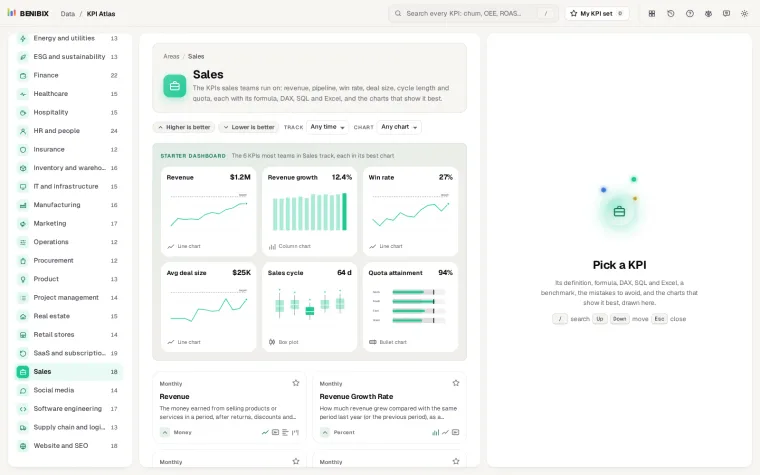
KPI Atlas has customer retention rate and repeat purchase rate with their formulas, the DAX, SQL and Excel above, the mistakes to avoid and their best charts drawn, next to churn rate, net revenue retention and customer lifetime value. It holds 455 KPIs for 30 areas of a business.