Short answer: data visualization means showing numbers as a picture, a chart, so a pattern is seen at once instead of read row by row. Choose the chart by your question: a line for change over time, bars to compare, a donut for parts of a whole, a histogram for how values spread.
A table of 200 numbers holds the answer, but nobody sees it. The same numbers as a line show in one second that sales dropped in March. That is the whole job of a chart: make the one thing that matters visible.
Which chart answers which question?
| Your question | Chart | Why |
|---|---|---|
| How did it change over time? | Line | The slope shows the direction. |
| Which is bigger? | Bar | Lengths side by side are easy to compare. |
| What share is each part? | Donut or pie, with two to five parts | Slices of one whole. |
| How are the values spread? | Histogram | Counts per range show the shape. |
| Do two numbers move together? | Scatter | Each dot is one item, on two scales. |
| Are we on target? | Bullet chart | The bar against a target mark. |
Why start with the question?
Most bad charts are picked by habit: a pie because it looks friendly, a line because the last report had one. A pie with twelve slices or a line through categories with no order hides the answer. Name the question first ("which region sold most?"), and the chart follows from it.
What else decides the chart?
The shape of your data. How many categories you have, how many points in time, how many numbers per item. Five regions fit a bar chart; fifty fit a sorted bar chart or a table. Two years of months fit a line; two numbers fit a sentence.
What makes a chart easy to read?
- One message per chart. If it says two things, make two charts.
- Sorted bars, unless the order means something (months, sizes).
- Colour for meaning only: one highlight, the rest grey. Palettes everyone can read covers colour blindness.
- Direct labels instead of a legend when there is room.
More on single charts: the histogram, the pie chart and bar or column.
Where can you check this?
Can a tool pick the chart with you?
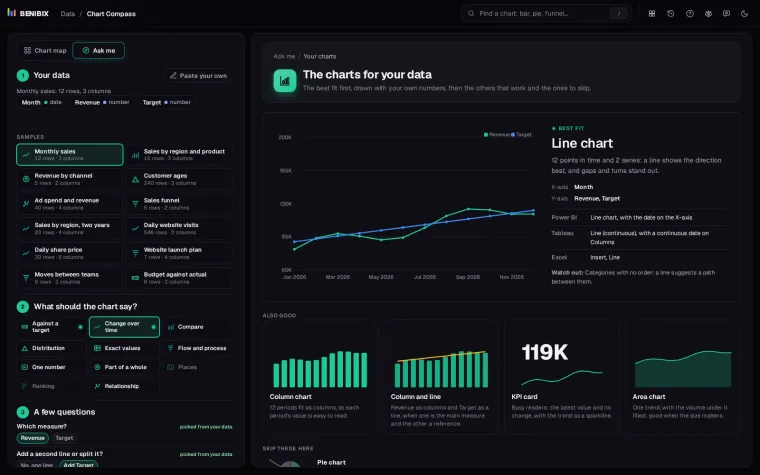
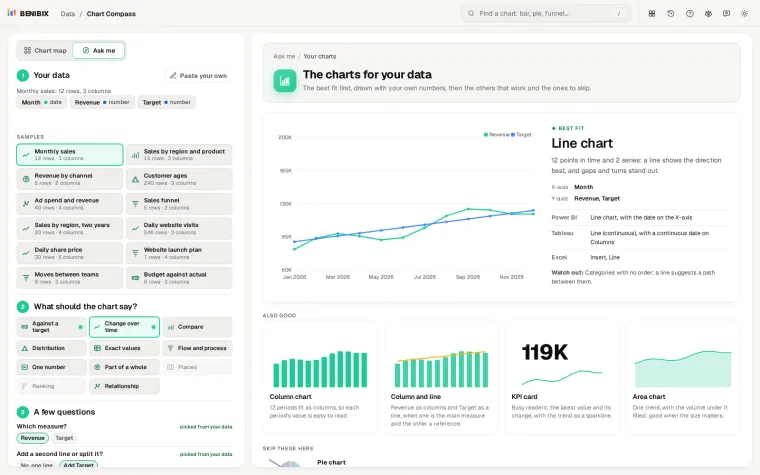
Chart Compass does this with your own numbers. Paste a table, say what the chart should show, answer two or three questions, and it draws the charts that fit, ranks them with the reason for each, and names them in Power BI, Tableau and Excel. Its chart map holds 50 charts grouped by 11 things a chart can say. Which chart should I use? goes through the questions in more depth.