Short answer: a histogram shows how one set of numbers is spread out: it splits the range into equal bins and counts how many values fall into each. It looks like a bar chart, but its bars are number ranges, so they touch, stay in order, and are never sorted by size.
People reach for a bar chart when they want to see "how the values are distributed", then wonder why it shows twenty bars of one each. A histogram answers that question; a bar chart answers a different one.
How do you read a histogram?
The horizontal axis is the value, split into ranges (bins). The vertical axis is how many values fall in each range. Delivery times are a good example:
| Delivery time | Orders |
|---|---|
| 0 to 1 day | 12 |
| 1 to 2 days | 48 |
| 2 to 3 days | 31 |
| 3 to 4 days | 9 |
| 4 to 5 days | 6 |
Drawn as touching bars, this shows at a glance where most orders land, how wide the spread is, and that a long tail of slow deliveries exists. NIST's handbook lists what a histogram reveals: the centre, the spread, whether the data is skewed, outliers, and whether there is more than one peak.
How is a histogram different from a bar chart?
| Histogram | Bar chart | |
|---|---|---|
| What the bars are | Ranges of one number | Separate categories |
| Gaps between bars | No, the ranges touch | Yes |
| Order | Fixed, low to high | Free; often sorted by size |
| Question it answers | How are the values spread? | Which category is bigger? |
If you could reorder the bars without losing meaning, it is a bar chart. If reordering would break it, it is a histogram.
How many bins should you use?
There is no single right number. The bin edges can be set by hand or by a rule; NIST mentions rules such as Scott's. In practice, try a few sizes: too few bins hide the shape, too many turn it into noise. Pick the one where the shape is clear and stays when you nudge the size.
When should you not use a histogram?
- For categories (products, regions): use a bar chart. Bar or column chart helps with the choice.
- For change over time: use a line chart.
- For very few values: with ten numbers, show the numbers.
Where can you check this?
Can you check which chart your data needs?
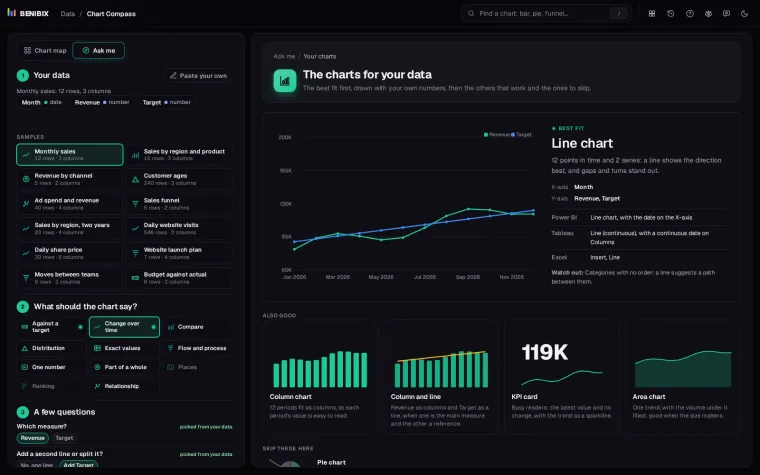
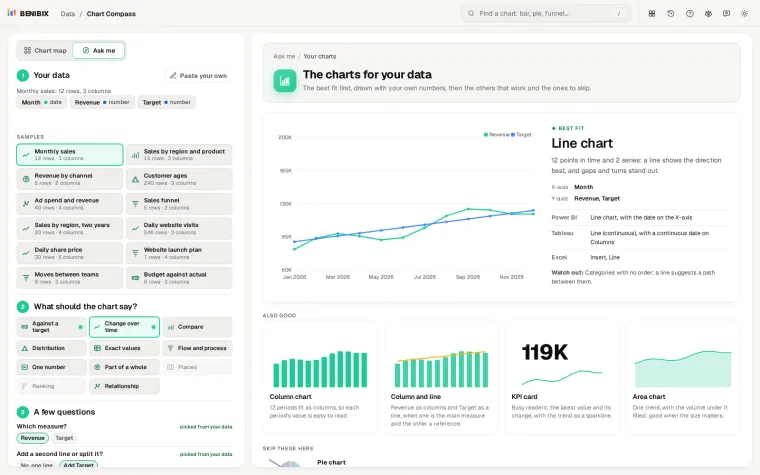
"How are my values spread?" is one of 11 things a chart can say in Chart Compass. Paste your data, say what the chart should show, and it draws the charts that fit with your own numbers, a histogram for a spread among them, with each chart's name in Power BI, Tableau and Excel. Which chart should I use? covers the other ten.