Short answer: 1. Write the one sentence the chart should say. 2. Pick the chart that says it: a bar to compare items, a line for change over time, a donut for a few parts of a whole. 3. Cut everything that does not help that sentence, and make the sentence the title.
Most charts start the other way round: select the data in Excel, click a chart icon that looks nice, and hope the point shows. Sometimes it does. Usually the reader gets a busy picture and has to find the point alone. Three steps, in this order, fix that.
Step 1: what should the chart say?
Write it as a sentence with a verb, before you touch the data:
- "Sales doubled between March and June."
- "The North sells twice as much as the South."
- "Two products make half of all returns."
If you cannot write the sentence, you are not ready to make the chart yet. You may need two charts, or a table.
Step 2: which chart says it?
The sentence tells you what kind of message it is, and the kind picks the chart:
| Your sentence is about | Use | Example |
|---|---|---|
| Comparing items | Bar chart, sorted | Sales by region |
| Change over time | Line chart | Sales by month |
| A few parts of one whole | Donut, two to five parts | Share of orders by channel |
| How two numbers move together | Scatter plot | Ad spend against sales |
Not sure? A sorted bar chart is rarely wrong. The full list of what a chart can say, with the charts to avoid for each: which chart should I use?
Step 3: what do you cut?
Everything that does not help the sentence:
- The legend, when you can label the line or the bars directly.
- Gridlines, borders and backgrounds. Keep at most light horizontal lines.
- Extra decimals. 86 thousand reads faster than 86,214.37.
- Colour for its own sake. One colour for the bars, one highlight for the one that matters.
- 3D and shadows. They distort the sizes you want people to compare.
Then replace the label title with the message. "Sales by month" names the data; "Sales doubled between March and June" tells the reader what to see in it.
What does that look like with real numbers?
| Month | Sales (thousand) |
|---|---|
| Jan | 40 |
| Feb | 41 |
| Mar | 42 |
| Apr | 70 |
| May | 82 |
| Jun | 86 |
- Sentence: sales doubled between March and June (42 to 86 thousand, 2.05 times).
- It is change over time, so a line chart, months along the bottom.
- No legend (one line), light gridlines, a label on the March and June points only, title "Sales doubled between March and June".
Where can you check this?
Can you get the chart picked for you?
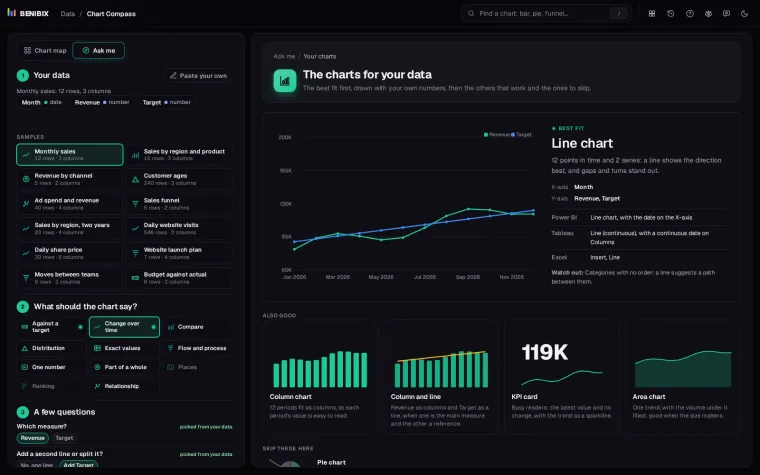
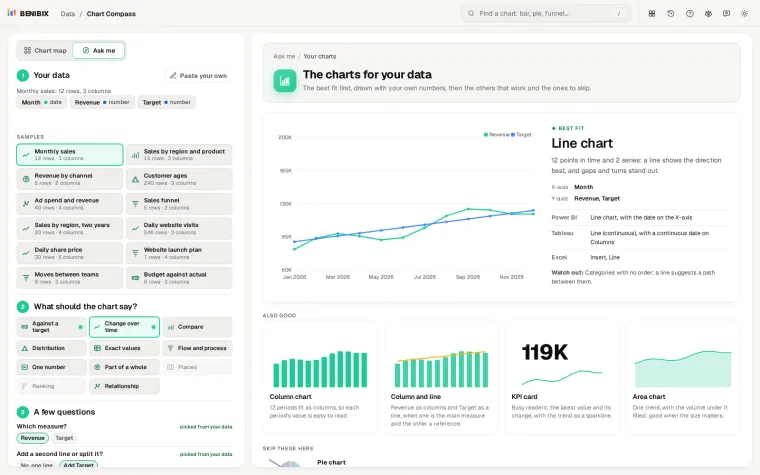
Step 2 is where most people get stuck. Chart Compass takes your pasted data and what the chart should say, asks the two or three questions it cannot answer from the data, and draws the charts that fit with your own numbers, with what each is called in Power BI, Tableau and Excel.