Short answer: a metric is any number you measure. A KPI (key performance indicator) is one of the few metrics tied directly to a goal, with a target, an owner and a direction that says what "good" is. Every KPI is a metric; most metrics are not KPIs. Website sessions is a metric. Trial-to-paid conversion rate, with a target of 18% this quarter and a growth team that owns it, is a KPI.
What is the difference, in one table?
| Metric | KPI | |
|---|---|---|
| What it is | Any measured number | A metric chosen to track a goal |
| How many | Hundreds | A handful per team |
| Has a target | Not necessarily | Always |
| Has an owner | Not necessarily | Always |
| Leads to action | Sometimes | When it moves the wrong way, someone acts |
| Where it lives | Reports, analysis, drill-downs | The top of a dashboard |
How do you tell a KPI from a metric?
A metric is a KPI when you can answer yes to all four:
- Is it tied to a goal? "Grow revenue from existing customers" is a goal; net revenue retention measures it.
- Does it have a target? 110% by year end. Without a target, nobody can say if this month was good.
- Does someone own it? One team or person whose job is to move it.
- Would we act if it moved? If it dropped 20% and nothing would change, it is a metric to watch, not a KPI.
What do examples look like side by side?
| Area | Metrics (useful context) | KPIs (what the team is judged on) |
|---|---|---|
| Sales | Calls made, meetings booked, pipeline value | Revenue, win rate, quota attainment |
| Marketing | Impressions, clicks, followers | Customer acquisition cost (CAC), return on ad spend (ROAS) |
| SaaS | Logins, features used, tickets | Monthly recurring revenue (MRR), churn rate, net revenue retention |
| E-commerce | Sessions, page views, time on site | Conversion rate, average order value, repeat purchase rate |
| Operations | Machine hours, units started | Overall equipment effectiveness (OEE), on-time delivery |
| Finance | Number of invoices, expense lines | Gross margin, days sales outstanding (DSO), cash runway |
The metrics on the left are not useless. They explain why a KPI moved: revenue fell because meetings booked fell, which fell because calls made fell. That is their job: drivers and diagnosis, one level below the KPI.
What are leading and lagging KPIs?
KPIs come in two kinds, and a good set has both:
- Lagging KPIs report the result after it happened: revenue, churn, profit. They are what the business is judged on, but by the time they move, it is too late to change that period.
- Leading KPIs move first and predict the lagging ones: pipeline coverage predicts revenue, product usage predicts churn, on-time delivery predicts repeat orders.
Pair each important lagging KPI with one leading KPI you can act on this week.
How many KPIs?
Fewer than you think. A team dashboard usually needs five to seven KPIs at the top, with metrics below or one click away. Past ten, nothing is "key" any more, and meetings turn into reading numbers aloud.
A practical way to get there: list every number your team reports, run each one through the four questions above, and keep only those with four yeses. Most lists shrink by two thirds.
Where can you check this?
Why define each KPI once?
The biggest KPI problem in most companies is not the choice, it is the definition. Sales and finance both report "revenue" and get different numbers, because one counts bookings and the other invoiced revenue net of refunds. Write down for each KPI:
- The formula, in words and in your tool's language (DAX, SQL or a spreadsheet formula)
- The direction: is higher or lower better, or should it stay in a range?
- How often it is measured, and the target
- The data it needs, and the mistakes that make it lie
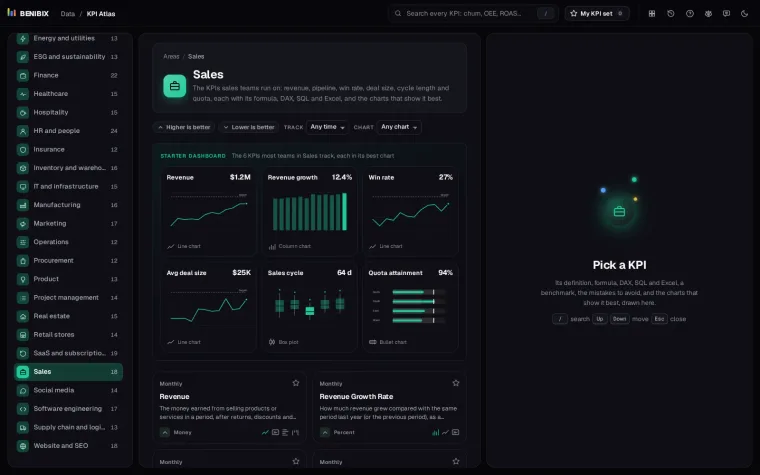
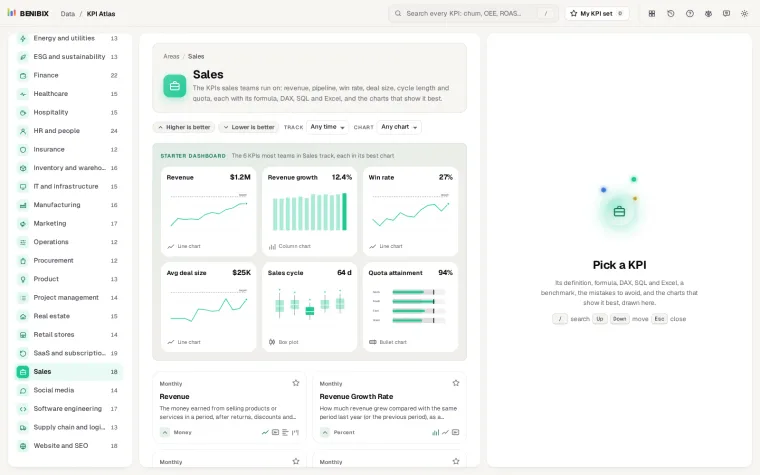
KPI Atlas has 455 KPIs for 30 areas of a business, each with exactly that: the definition, the formula, ready-to-copy DAX, SQL and Excel, a benchmark, the common mistakes, and the charts that show it best. Each area starts with a starter set of the three to seven KPIs most teams track.