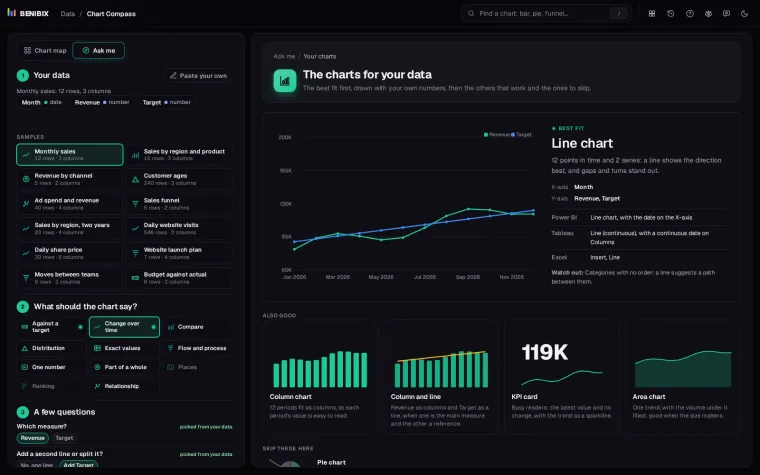
Short answer: use a line graph when the question is "how did this change over time?": time on the bottom axis, a value on the left, and enough points that the shape matters more than any single number. Do not use one for categories with no order, and do not put more than about four lines on it.
Most line graphs that go wrong are not wrong charts; they are the right chart with too much on it. Twelve products as twelve lines is a plate of spaghetti. The fix is in the data you leave off, not in the chart type.
What does a line graph show?
Points in order, joined by a line. Left to right is time, up is more, and the slope is the speed of change. Microsoft's line chart guide puts it the same way: continuous data as points connected by lines, for trends, seasonal effects and long-term changes.
Because the reader follows the shape, a line can carry many more points than a column chart: a year of daily values is 365 points and still readable, where 365 columns would be a wall.
When should you use one?
| The question | The chart |
|---|---|
| How did revenue change this year? | Line |
| Which month was biggest? | Column |
| What share of the total is each region? | Stacked column or donut |
| How are the delivery times spread? | Histogram |
Use a line when:
- The horizontal axis is time, or another ordered measure such as age or distance.
- There are many points. With twelve or fewer periods, columns show each value better; from there up, a line shows the direction better.
- You want to compare a few series: two or three lines on one axis make the gap between them obvious.
When should you not use a line graph?
- Categories with no order. Products, regions or teams have no "between", and a line suggests a path from one to the next. Use bars.
- Few periods where the exact values matter. Six quarters of budget against actual read better as columns with labels.
- Two measures on different scales. Two lines on two axes suggest a link the scales can fake. If the second measure matters, give it its own small chart.
What is the spaghetti problem?
Every line you add makes every other line harder to follow. Four is a sensible ceiling. Past that you have three ways out:
- Highlight one. Draw the line that answers the question in colour and the rest in light grey. The grey ones give context without competing.
- Small multiples. One small chart per series, all on the same scale. Chart Compass suggests this as soon as three series would share one line chart.
- Label at the end. Put each series name at the right end of its line instead of in a legend, so the reader never has to match colours.
Does the axis have to start at zero?
Not for a line. The reader follows the shape, not the height from the floor, so a Y-axis from 80 to 100 is fine when the movement is what matters. Say so in the axis labels, though, and never do the same with columns, where height is the message.
What is it called in Power BI, Tableau and Excel?
| Tool | Where to find it |
|---|---|
| Power BI | Line chart, with the date on the X-axis. Power BI also has area, stacked area and 100% stacked area variants |
| Tableau | Line (continuous), with a continuous date on Columns |
| Excel | Insert, Line |
Where can you check this?
Can you check whether your data wants a line?
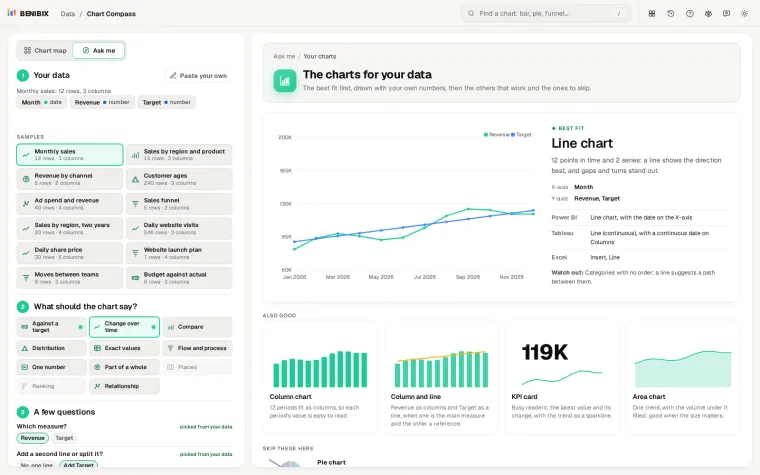
"How did it change over time?" is one of the 11 things a chart can say in Chart Compass. Paste your data, say what the chart should show, and it draws the charts that fit with your own numbers, a line chart among its 50, and warns when the series would tangle. Each chart comes with its name in Power BI, Tableau and Excel. Which chart should I use? covers the other ten things a chart can say.